
Why Should You Consolidate Your AI Tools for Faster Scaling?...
Read More


Why is Deployment Speed the New 2026 AI Moat?
Why is Deployment Speed the New 2026 AI Moat? The...
Read More
We Don’t Just Build AI, We Deliver Measurable Impact
We Don’t Just Build AI, We Deliver Measurable Impact Join...
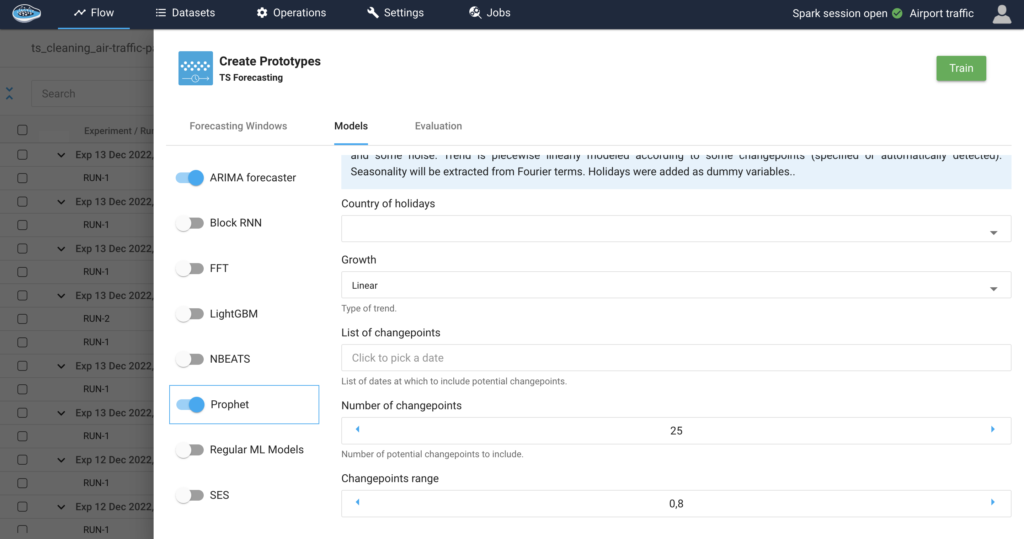
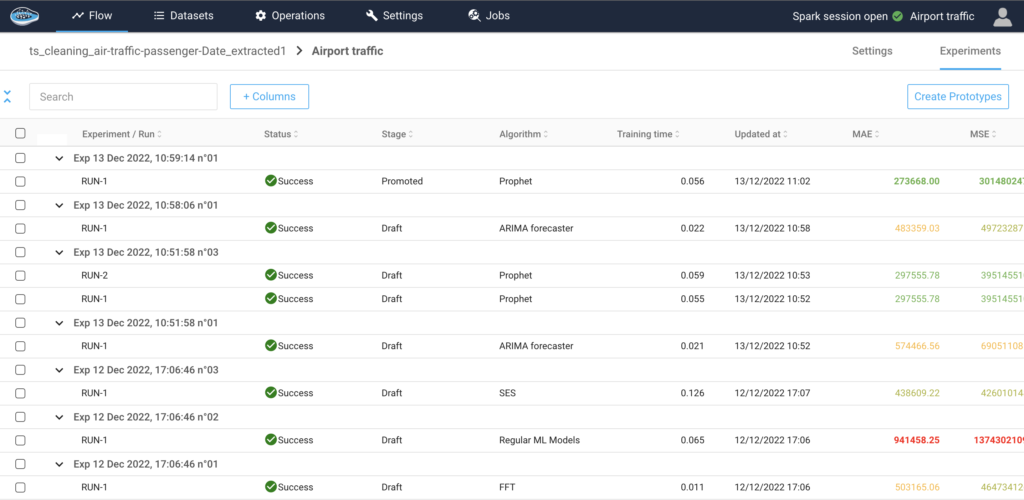
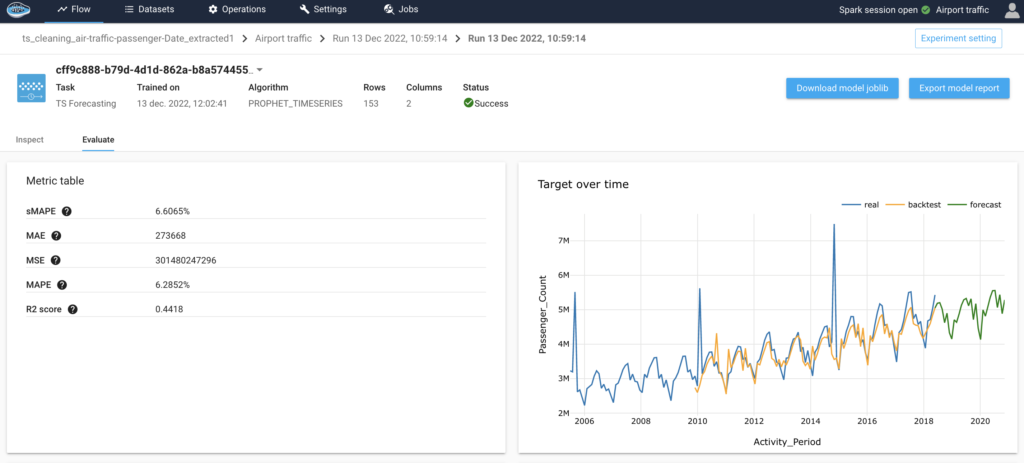
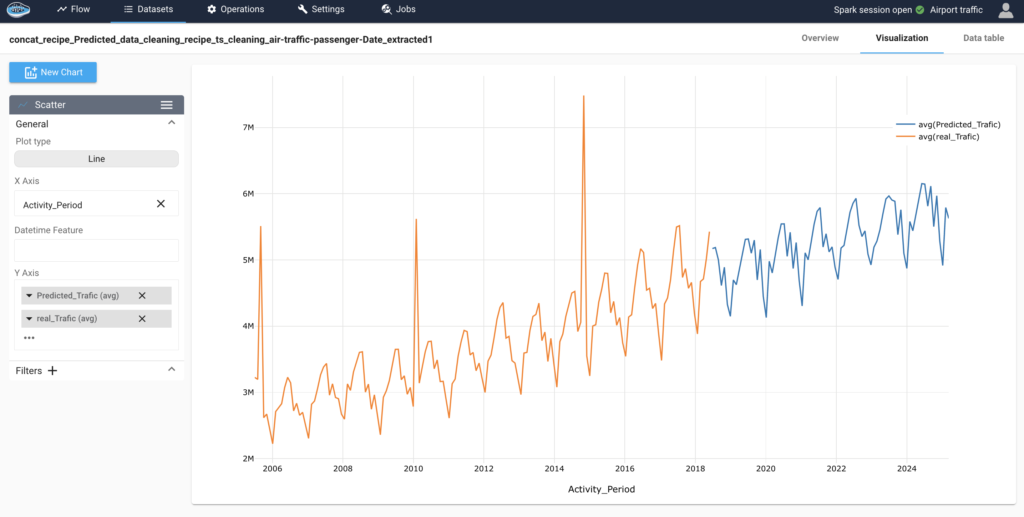
Read MoreAirport Passenger Flow Forecasting using papAI