
Why Should You Consolidate Your AI Tools for Faster Scaling?...
Read More


Why is Deployment Speed the New 2026 AI Moat?
Why is Deployment Speed the New 2026 AI Moat? The...
Read More
We Don’t Just Build AI, We Deliver Measurable Impact
We Don’t Just Build AI, We Deliver Measurable Impact Join...
Read More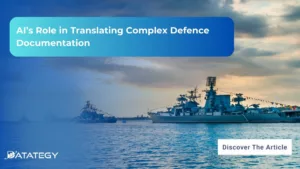
AI’s Role in Translating Complex Defence Documentation
AI’s Role in Translating Complex Defence Documentation The defence sector...
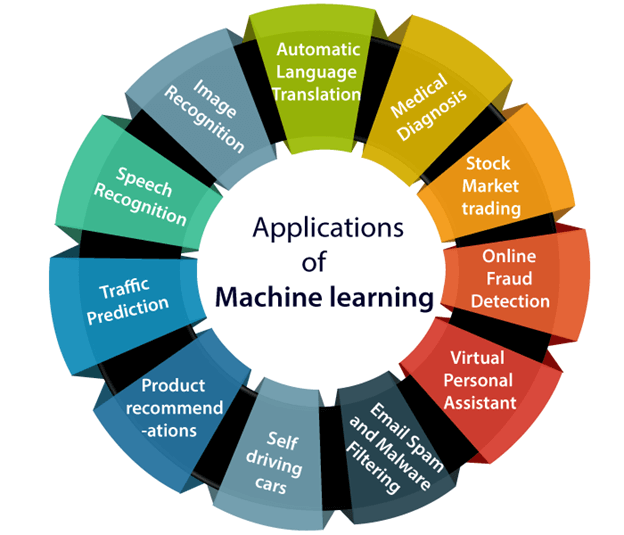
Read MoreUnleashing the Power of Personalization: How Machine Learning is Transforming Customer Segmentation to Improve Marketing Strategy?