How AI-Powered Anti-Drone Solutions Transform Defense Operations? Drones are everywhere...
Read MoreNext-Gen Urban Ride Platforms: Forecasting Demand & Costs using papAI
Table of Contents
ToggleThe field of urban mobility is constantly changing. Data-driven strategies are now the preferred method for improving demand forecasting and cost management as a result of the development of advanced technology in recent years. This is to make transport systems more effective and environmentally friendly. Data can reveal insights into how people travel around cities.
In this article, we’ll examine the value of data-driven decision-making in urban ride platforms as well as how papAI, is transforming how we run urban transportation networks.
What do We Mean by "Data-Driven Urban Transport"?
The idea of data-driven decision-making has been revolutionary in the field of urban transportation. Utilizing the enormous quantity of data created by numerous sources, including GPS devices, cellphones, and public transit systems, can help you better understand data-driven urban transportation by giving you priceless insights into commuter behavior, traffic patterns, and public transit use.
Transportation authorities may understand specific information about how people travel throughout cities, the most popular routes, and the reasons influencing commuter decisions by using data analytics as their foundation. City planners and transportation organizations may make wise choices to enhance citizens’ overall mobility experiences by studying this abundance of information.
Additionally, data-driven urban transport makes it easier to pinpoint peak times, allowing transit agencies to properly distribute resources during periods of high demand. Services may be improved, waiting times can be cut down, and commutes can be made more comfortable and dependable by anticipating passenger preferences and travel patterns.
The Value of Demand Forecasting for Urban Transport
Due to its revolutionary potential in three crucial areas—efficient resource allocation, enhanced passenger experience, and sustainable urban development—demand forecasting for urban transportation is of great interest to cities and transportation authorities.
First, by using demand forecasting, cities may best allocate resources to their transit networks. Authorities may modify the frequency and capacity of public transportation services and distribute the right number of vehicles for ride-hailing services by precisely forecasting demand trends. The efficient use of resources is ensured by this data-driven methodology, which lowers operating costs and improves overall service quality. A more efficient and effective urban transport system will come from the allocation of resources so that transport agencies may deliver dependable and timely services that address the actual demands of commuters.
Demand forecasting improves transportation operational effectiveness for urban enterprises. Businesses may predict peak periods and change their operations accordingly thanks to accurate projections. For instance, firms might use more transportation resources to handle increased demand during busy times or promotional events. This proactive strategy guarantees smoother operations, lowers delivery delays, and increases the supply chain’s overall effectiveness. Demand forecasting also helps to see trends and patterns, allowing businesses to make data-driven decisions and modify their plans in response to shifting customer preferences and market conditions.
Impact of Data-driven Approach to Reducing Costs
Businesses are significantly impacted by the data-driven approach to cost reduction in urban enterprise transportation, which results in increased operational effectiveness, optimized resource allocation, and considerable cost savings.
A data-driven strategy helps companies to learn crucial information about transportation operations. Businesses may spot inefficiencies and potential areas for development by analyzing vast amounts of data, including historical transportation trends, consumer preferences, and real-time traffic statistics. Businesses may simplify their logistics and supply chain operations thanks to this data-driven research, which lowers the cost of transportation. For instance, Deloitte research discovered that companies may save up to 10% on costs when they use data analytics for transportation management.
Data-drive Benefits for Urban Transport?
1- More Accurate Forecasts
Data-driven demand forecasting uses both historical and current data to provide accurate projections. Large datasets may be analyzed by transportation authorities to find patterns, trends, and seasonal fluctuations, leading to more precise predictions of passenger demand. The possibility of overloaded or underutilized services is decreased because to better resource allocation and planning made possible by this precision.
2- Effective Resource Allocation
Accurate demand estimates enable transport providers to distribute resources in a more efficient manner. Data-driven insights enable better decision-making, resulting in optimized service levels and increased customer happiness, regardless of whether the choice is to schedule public transit services or manage ride-hailing fleets.
3- Improve Traffic Flow
Demand forecasting includes traffic management in addition to public transportation. Traffic authorities can anticipate congestion areas and proactively change traffic flow by analysing historical and real-time traffic data. This makes traffic jams and delays less of an issue, making travel easier and safer.
4- Responsive Crisis Management
Data-driven demand forecasting may be extremely important during unanticipated occurrences or crises, such as natural catastrophes or public health situations. To comprehend shifting travel habits and modify transport services to meet changing demands, authorities can analyse real-time data.
5- Better Event Planning
When preparing for holidays or other special occasions, data-driven demand forecasting is very helpful. By looking at prior event-related travel patterns, authorities can forecast rising demand and make the necessary adjustments to transport systems, ensuring smooth and efficient event logistics.
How to choose the best AI solution for your data project?
In this white paper, we provide an overview of AI solutions on the market. We give you concrete guidelines to choose the solution that reinforces the collaboration between your teams.

Case study: How to predict the number of races with papAI?
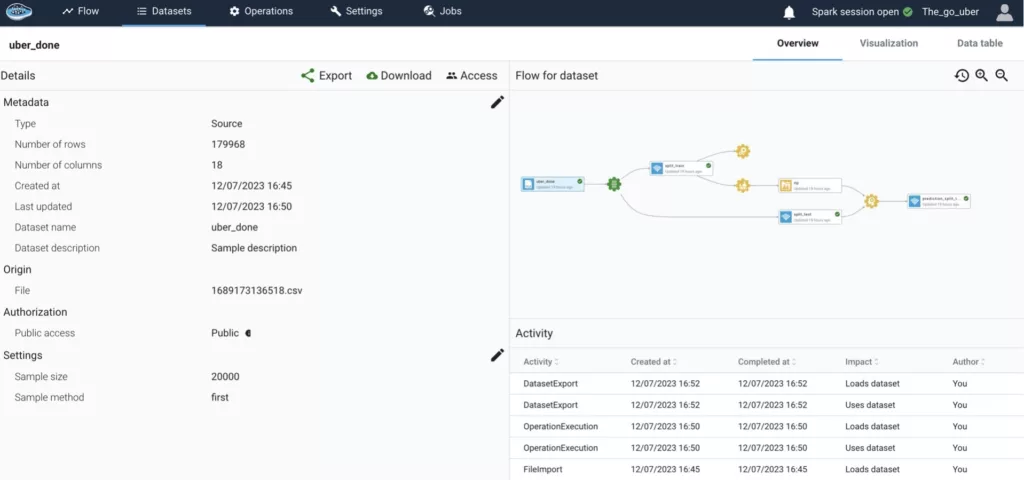
Dataset Presentation
In this study, two datasets were used to gain insights into Uber transportation system. The first dataset comprises two hundred thousand Uber rides spanning six years from 2009 to 2015. It includes essential information like pickup and drop-off locations (latitude and longitude), pickup date and time, number of passengers, and fare amount. This dataset was specifically used to predict fare estimates accurately.
The second dataset is more comprehensive, consisting of a staggering one million and eight hundred thousand ride records. It covers a three-month period, specifically April, May, and June of 2014. The dataset contains crucial information such as pickup longitude, latitude, and the corresponding pick-up time. This dataset played a significant role in determining the hourly customer demand pattern.
Data Preprocessing
When conducting our data analysis, one of the initial steps was to handle any missing values in our dataset, we found that our data had remarkably few null values.
To gain deeper insights, we used the Haversine formula in our research to calculate the distance covered by each trip. This distance measurement was then included as a new feature in our analysis, as it had the promising potential to uncover a correlation with the fare price. During our examination of the fare prediction dataset, we encountered a discrepancy when incorporating the distance column into our analysis. After a thorough investigation, we discovered inaccurately recorded essential information, resulting in longitude and latitude columns with 0 values. This unexpected anomaly raised concerns about the accuracy and reliability of the data.
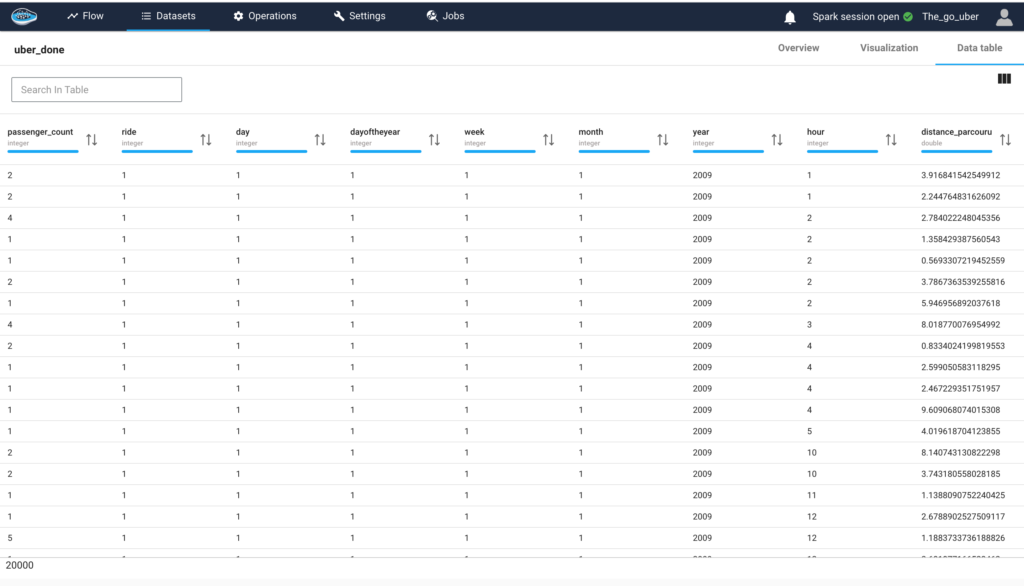
Additionally, we identified another irregularity where trips with relatively short distances exhibited abnormally high fares. To address these inconsistencies, we made the decision to exclude records with distances exceeding 50 kilometers or falling below 0.4 kilometers. Moreover, we removed trips with travel distances surpassing 3 kilometers but charging less than 10 dollars.
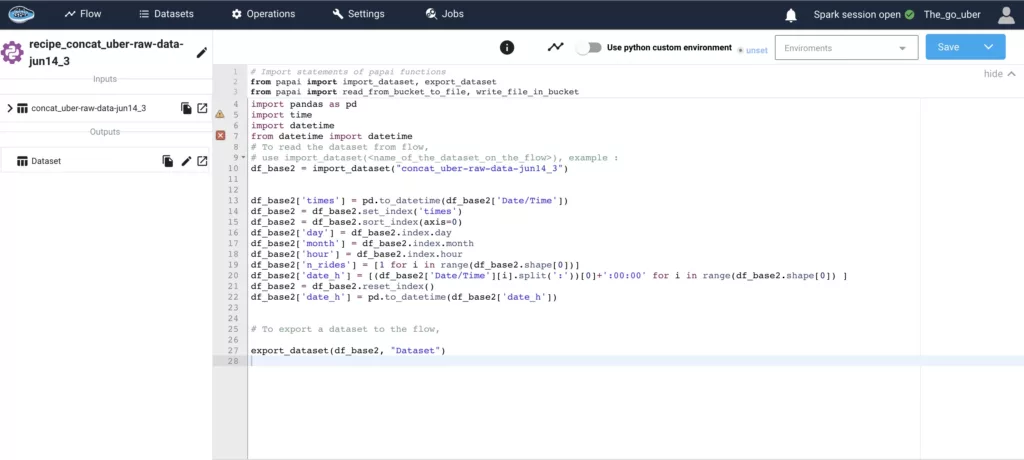
Shifting our focus to the dataset for demand forecasting, we extracted various temporal attributes from the pickup date and time. These attributes encompassed the day, month, day of the year, and week. These additional columns provided valuable insights into the temporal patterns present within our dataset.
Exploratory Data Analysis
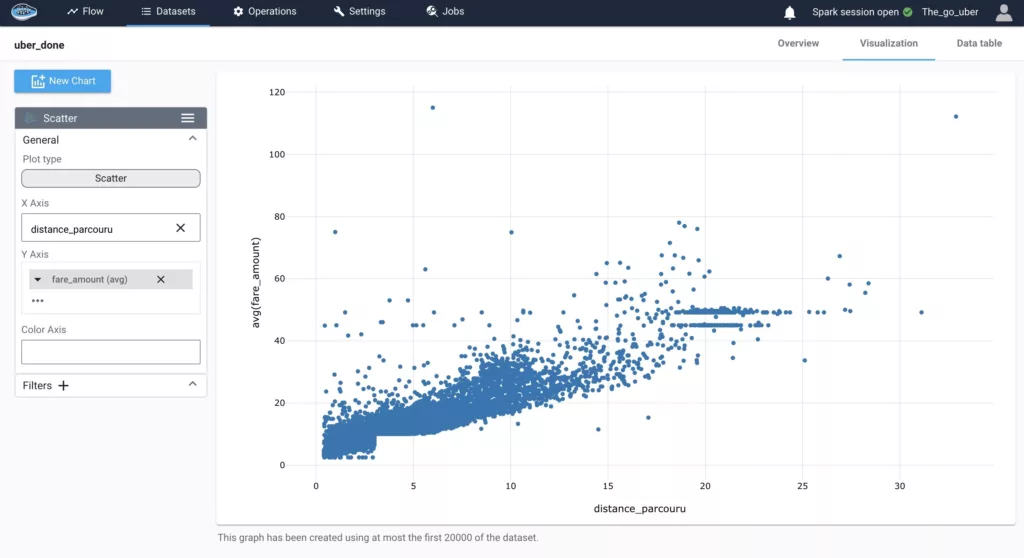
> Plot of fare against distance traveled.
We can see that there is linearity between the two variables, we also notice a complex interaction between the two features it could be explained by time of demand, number of demand, traffic conditions, and others, though this graph gives us an idea to use linear regression for predicting the price of the ride, still, it would be interesting to use other models like decision trees, random forest as they work well for outliers and also when the relationship between variables is complex.
—> Plot of the sum of hourly demand during a month for April, May, and June.
We used the complete dataset from April, May, and June 2014 to examine the distribution of the sum of the number of Uber rides during the daytime hours. Upon analyzing the data, we observe the presence of two distinct peaks in the distribution curve. Notably, the second peak, which occurs in the evening, exhibits a higher count than the first peak.
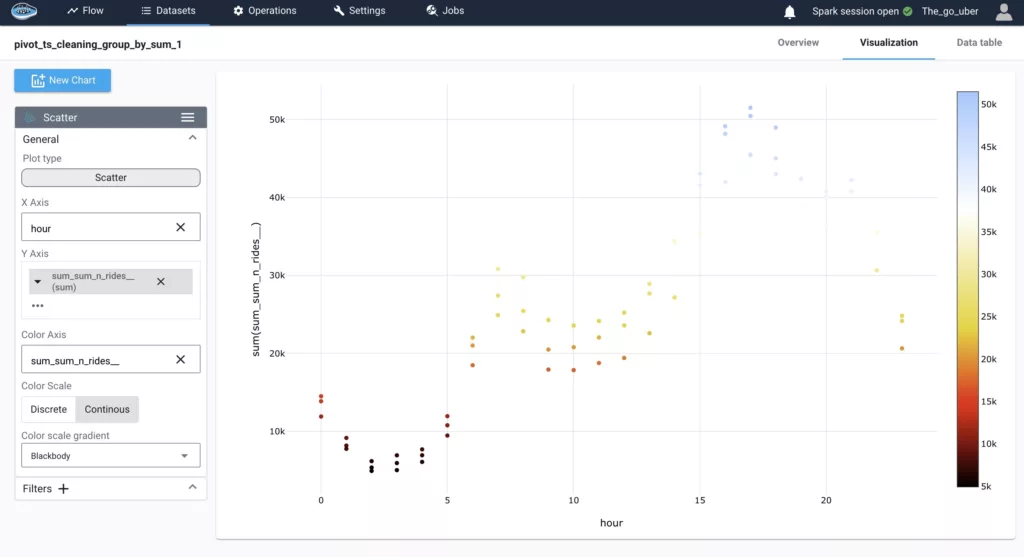
Further investigation into the factors influencing this pattern could provide valuable insights into the demand dynamics and potential strategies for optimizing Uber’s services during these peak hours.
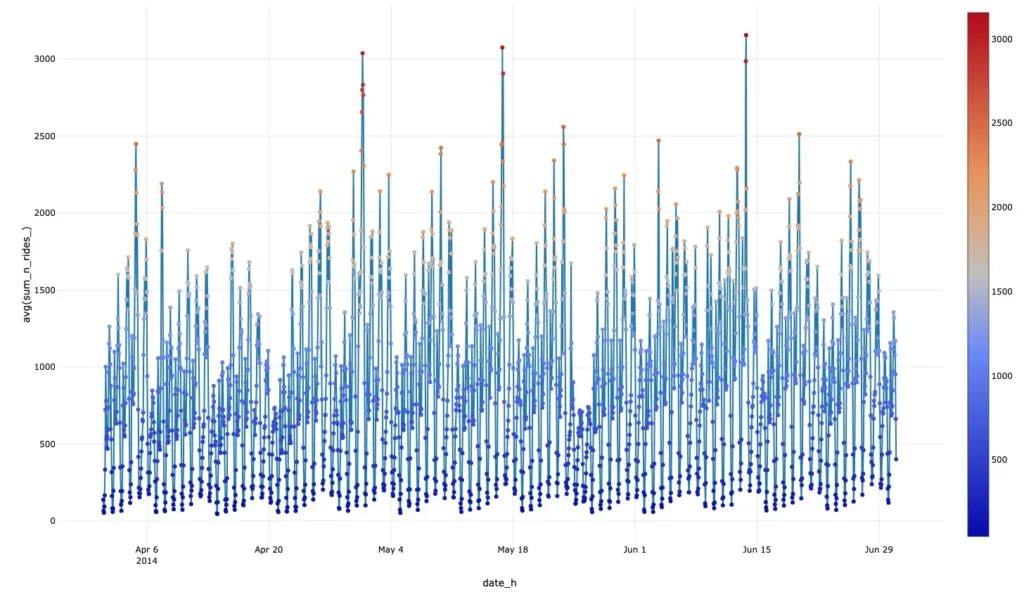
—> Image of the hourly demand from April to June 2014.
In this plot, we analyze the distribution of the hourly number of Uber rides and observe a consistent, stationary pattern. To enhance the accuracy of our forecasting models, it is crucial to perform a detailed mathematical verification of the stationarity.
By ensuring that the data exhibit stationarity, we can confidently apply various time series analysis techniques, to make accurate predictions about future ride volumes. Stationarity verification involves assessing the mean, variance, and autocorrelation structure of the data, ensuring they remain constant over time.
By conducting a thorough mathematical verification of stationarity in the dataset, we can facilitate reliable and robust forecasting for Uber ride volumes.
—> Videos of the heat map portraying the demand for services from 4 PM to 8 PM, comparing the day with the highest volume to the day with the lowest volume.
In our quest to unravel meaningful patterns within Uber’s vast dataset, we embarked on an analysis aimed at identifying the days with the highest and lowest number of rides. Our investigation pinpointed April 30, 2014, as the day that recorded the maximum number of Uber rides, while May 26, 2014, marked the day with the least amount of activity.
Seeking to gain further insights into the distribution of Uber rides during peak hours, we employed a visualization technique in the form of a heat map. This visual representation enabled us to discern a consistent and notable customer demand within downtown New York. Specifically, areas near Penn Station on 31st Street and the proximity of Central Park emerged as hotspots for ride requests.
Armed with these valuable findings, Uber drivers can strategically position themselves to optimize their service and ensure prompt and efficient rides for customers. By leveraging this information, drivers can align their availability and routes with the high-demand areas, contributing to a seamless and delightful experience for riders.
This analysis serves as a testament to the power of data-driven insights, aiding both drivers and the Uber community in delivering superior service and meeting the ever-evolving needs of urban transportation.
Price Prediction using Multiple Predictive Models

For this task, we used multiple models:
1. Linear Regression: After visualizing the data, it became apparent that the variables exhibited a linear relationship. Therefore, we implemented linear regression and achieved favorable results with high R- squared and low mean squared error.
2. Decision Tree Regressor: This model constructs a flowchart-like structure to predict continuous target variables. Decision trees excel in scenarios with complex relationships, robustness to outliers, and feature interactions. They performed exceptionally well in this case, delivering the best results in terms of R-squared and mean squared error.
3. Random Forest: Random Forest is an ensemble algorithm that combines multiple decision trees for improved predictions. It addresses overfitting concerns by aggregating predictions, enhancing generalization. By averaging the results of multiple trees, it also mitigates sensitivity to changes in the data. We obtained satisfactory results with good R-squared and mean squared error using Random Forest.
4. Adaboost: This model combines multiple weak classifiers (decision trees with a single split) to create a strong classifier. It did not perform well in this case, as the obtained R-squared and mean squared error values were not satisfactory. (predict_df.jpeg)
R-squared (R²) is a statistical measure that represents the proportion of the variance in the dependent variable that can be explained by the independent variable(s). It quantifies the goodness of fit of a regression model, with values between 0 and 1. A value closer to 1 indicates a higher level of explanation or prediction accuracy
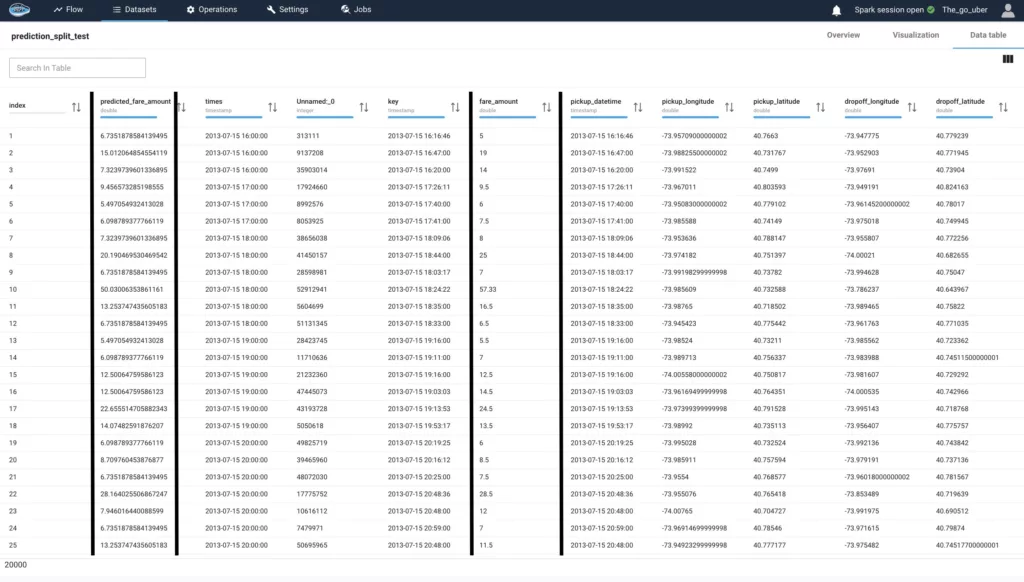
The model performed well on the test set, showcasing favorable results with an insignificant difference. To enhance the predictive capability, a larger dataset would be beneficial. Increasing the dataset size can potentially lead to improved predictions.
Hourly Demand Forecast
After exploring the dataset, we observed a stationary pattern in the hourly number of rides, indicating no significant trends, seasonality, or variation. To validate this observation, we conducted an ADF test, resulting in a p-value of 4.1066639175465434e-05, confirming the stationary pattern.
We used multiple lags (time intervals between observations) of 7, 14, 21, and 28 to uncover dependencies and correlations within the time series data. For our analysis, we implemented various models, and the Temporal Convolutional Network (TCN) achieved promising results with a mean absolute error of 89.92.

Mean Absolute Error (MAE) is a statistical measure that calculates the average absolute difference between the predicted and actual values.
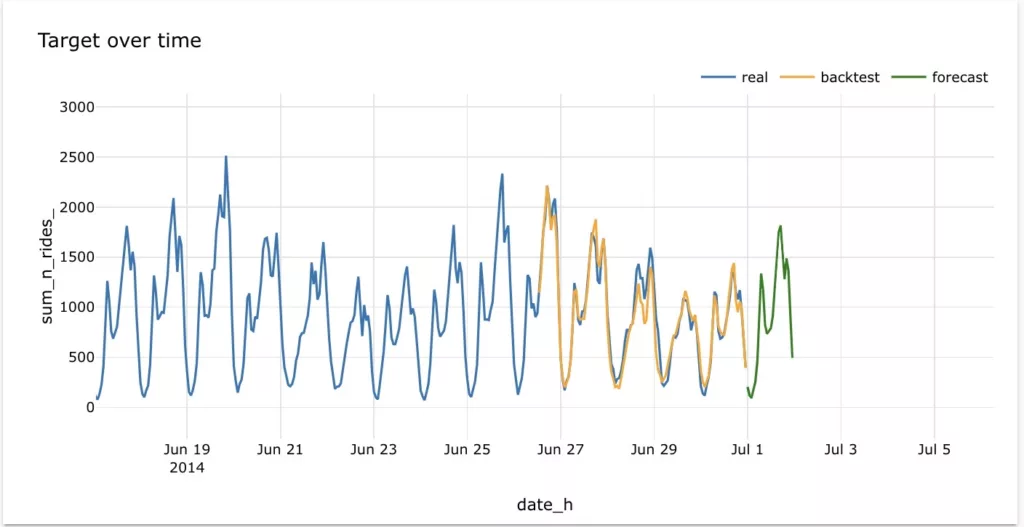
The forecast results indicate a strong correlation between the predicted and actual values, as depicted in the graph. The ratio of the two numbers approaches 1, suggesting a minimal difference between them.
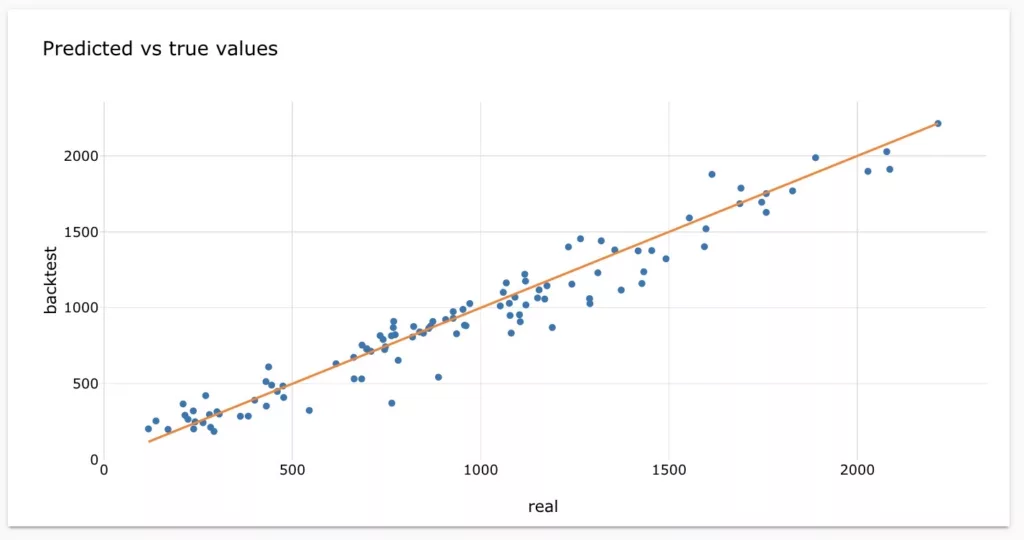
The graph illustrates the model’s effective forecasting performance, as the backtest consistently aligns with the actual trend. This indicates that the model performs well in capturing the patterns of the real data.
Conclusion
In conclusion, this article presented the development and evaluation of models for predicting fare costs and forecasting hourly demand in the context of ride-hailing services. Through our analysis, we have demonstrated the effectiveness of the models in capturing patterns and trends in the data.
The results indicated that accurate fare predictions and demand forecasts can be achieved by leveraging advanced modeling techniques. However, it is important to note that further improvements could be obtained by incorporating larger datasets and exploring additional factors that influence fare costs and demand patterns. Overall, these models offer valuable insights for optimizing operations and providing better services in the ride-hailing industry.
papAI solution assists in explaining and making the results clear through a process of data mining, purification, and visualization that helps speed up the implementation of AI initiatives. Decide on a demo time today. Our team of experts can help you create a unique AI-based solution that is specifically catered to the needs of your business.
Interested in discovering papAI?
Our commercial team is at your disposal for any questions
Transform Defense Logs & Rapport into Situational Awareness with AI
Transform Defense Logs & Rapport into Situational Awareness with AI...
Read MoreWhy AIOps Is Key to Cyber Threat Detection in Defense?
Why AIOps Is Key to Cyber Threat Detection in Defense?...
Read MoreHow AI Transforms Predictive Maintenance in Defense Equipment
How AI Transforms Predictive Maintenance in Defense Equipment In a...
Read More